1. Introduction
Particulate matter (PM) is a liquid or solid substance with a diameter less than 10 μm suspended in the atmosphere and is defined as PM10 and PM2.5 depending on the diameter (particle matter with an aerodynamic diameter less than 10 μm and 2.5 μm, respectively). It is known to increase the risks of various respiratory and cardiovascular diseases when introduced to the human body through breathing (e.g., [
1]). It is also known to cause cancers (e.g., [
2]), increase the early mortality rate, and affect dementia. In particular, PM2.5 can be deposited in small airways and alveoli due to its small size and can have a larger impact on respiratory and cardiovascular systems than PM10 because it can stay in the air longer (e.g., [
3]).
To protect people’s health against PM, the South Korean government has made various efforts since the 2000s, such as strengthening the management of particular matter emission sources, cooperating with neighboring countries, and implementing nationwide PM forecast and warning systems. In 2016, “special measures for the management of PM” were announced, and measures to improve the PM concentration through the scientific reduction in domestic emission sources, the development of new eco-friendly growth industries, cooperation with neighboring countries on the environment, and the innovation of forecast and warning systems were established.
As a result of these efforts, the PM10 concentration in South Korea was markedly reduced after 2007 and lowered to 45 μg/m
3 in 2012, compared to 1998 to 2006, when the PM10 concentration was 51 to 61 μg/m
3. Afterward, the concentration temporarily increased to the level of 49 μg/m
3 in 2013 and 2014, but it was reduced by 1 μg/m
3 every year from 2015 and reached 46 μg/m
3 in 2017. In the case of the PM2.5 concentration, it maintained the level of 26 μg/m
3 every year after the atmosphere environmental standards were added in January 2015, and slightly decreased to 25 μg/m
3 in 2017 [
4].
High PM2.5 episodes in South Korea, however, are still frequently occurring from autumn to spring. In particular, as northwesterly winds are formed under the influence of migratory anticyclones in spring and autumn and the Siberian anticyclone in winter, South Korea can be affected by trans-boundary PM from foreign high-emission areas. For the establishment of effective PM concentration reduction measures, the quantitative evaluation of the trans-boundary PM transported over long distances and its precursors is required along with the analysis of the influence of weather conditions and major emission sources affecting the generation and removal of PM.
Therefore, various related studies have been actively conducted. Kim et al. [
5] evaluated domestic and foreign contributions for the year 2014 by applying the brute-force method (BFM) to the Community Multiscale Air Quality (CMAQ) model. They found that foreign emissions affected up to 60% of the annual average PM10 concentration of the Seoul metropolitan area (SMA) and up to 70% in March among the cold seasons (from autumn to spring). Changes in weather conditions and emission in upwind countries can also have a close impact on PM concentrations in neighboring countries. Therefore, although a multi-faceted analysis is needed with high concentration cases, there is still an insufficient analysis of the quantitative contribution between countries in Northeast Asia.
As such, this study attempted to understand high PM concentrations from various perspectives for a severe PM2.5 episode that lasted from 27 February to 7 March in 2019 in the SMA of South Korea using weather and PM2.5 measurement data, satellite data, and air quality models. In addition, domestic and foreign contributions were estimated by applying BFM to the CMAQ model.
2. Data and Method
2.1. Observation
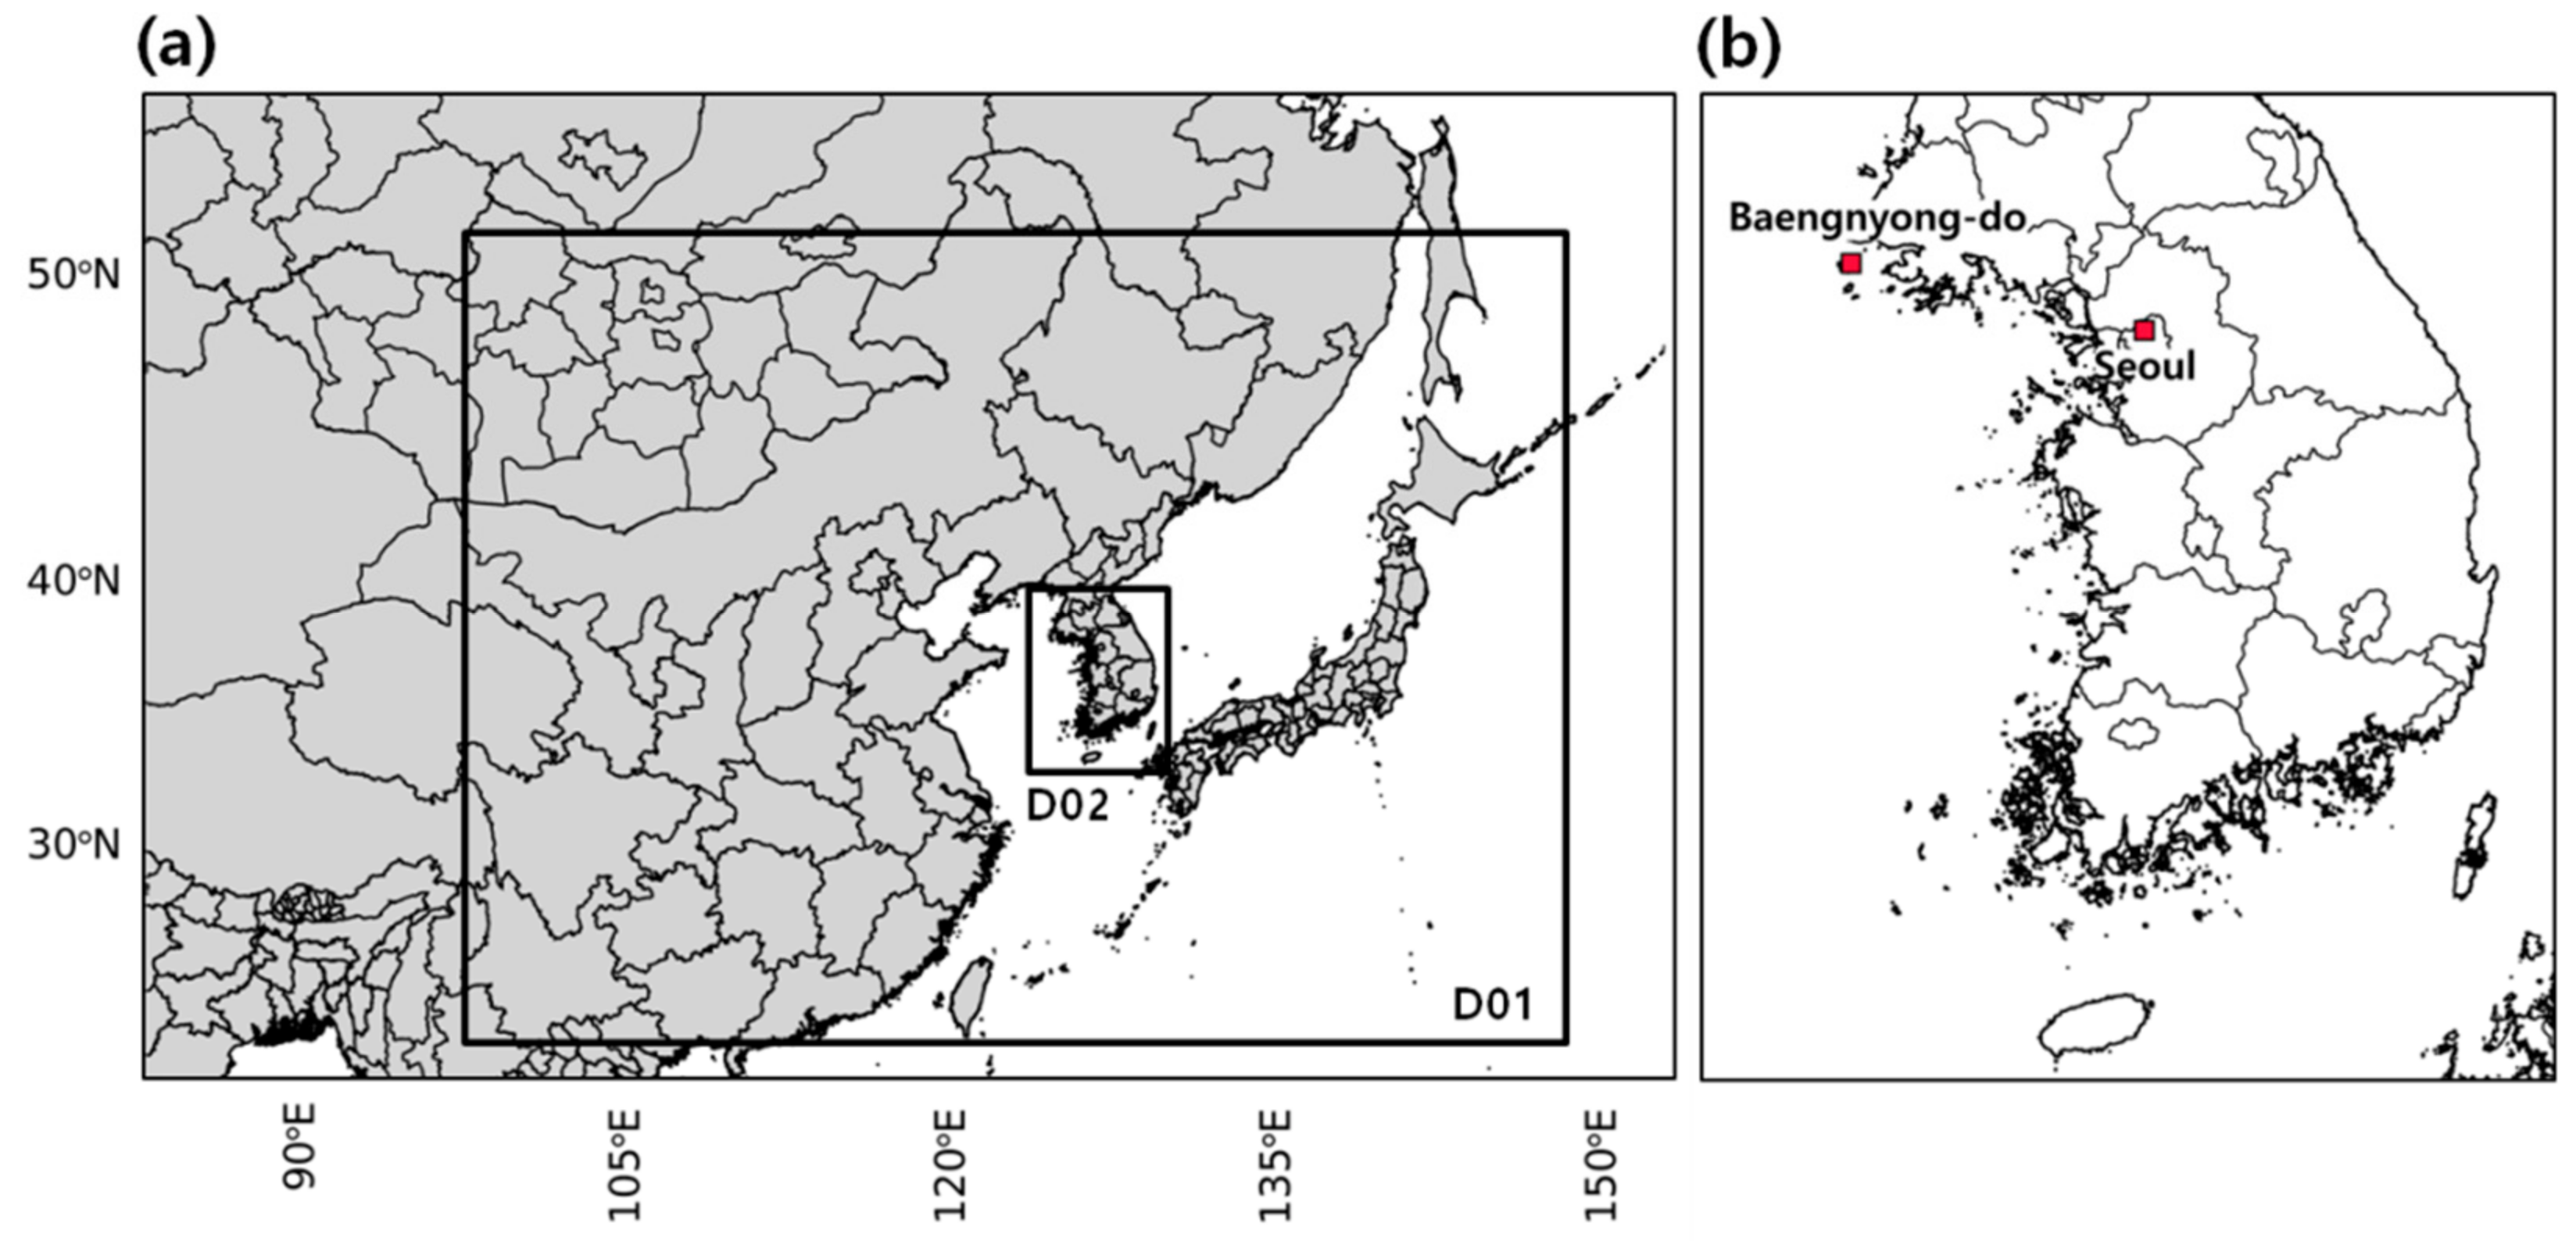
Ground measurement data were used to confirm the PM2.5 concentration levels in SMA during the target period of this study and to verify the PM2.5 simulation accuracy of air quality models. As for the ground PM2.5 measurement data used in this study, the real-time automatically-measured data from more than 130 urban air monitoring stations in SMA collected by the National Ambient air quality Monitoring Information System (NAMIS), which is operated by the National Institute of Environmental Research (NIER), were utilized. For the analysis of the weather conditions in the SMA region and the Yellow Sea during the target period of this study, the temperature, pressure, wind direction, wind speed, relative humidity, and cloud cover data of Baengnyeong-do and Seoul collected from the Automated Synoptic Observing System (ASOS) of the Korea Meteorological Administration (KMA) were used. In addition, the aerosol optical depth (AOD) data obtained from the Geostationary Ocean Color Imager (GOCI) were used to investigate the PM2.5 behavioral characteristics in Northeast Asia and compare them with the simulation results of air quality models.
2.2. HYSPLIT Model
A backward-trajectory analysis was conducted using the Hybrid Single-Particle Lagrangian Integrated Trajectory (HYSPLIT) model [
6,
7,
8] to analyze the transport route of the air mass that headed towards the SMA during the severe PM2.5 episode. Meteorological reanalysis data were used for modeling as meteorological data. In the backward-trajectory analysis, the origin of the air mass that was transported to the particular matter intensive monitoring stations in the SMA was analyzed, and re-simulation was performed for 100 and 1000 m altitudes to separate and analyze the movements of the lower and upper atmosphere.
2.3. Weather and Chemical Transport Model
2.3.1. Model Description
The meteorological models used in this study were Weather Research and Forecast (WRF) version 3.6 [
9], developed by the National Center for Atmospheric Research (NCAR), and CMAQ version 5.0.2 [
10] of the U.S. Environmental Protection Agency (EPA). These models were used to simulate the air quality in Northeast Asia. The simulation domains of WRF and CMAQ consisted of Domain1 (D01) for the Northeast Asia region, including South Korea, China, and Japan, and Domain2 (D02) for South Korea (
Figure 1).
Table 1 shows the grid numbers and horizontal resolution for each simulation domain.
Meteorology-Chemistry Interface Processor (MCIP) version 4.1, a preprocessing program, was used to apply the meteorological conditions in Northeast Asia simulated by WRF to CMAQ. In addition, natural emissions were produced using the Model of Emissions of Gases and Aerosols from Nature (MEGAN) version 2.04 [
11], and anthropogenic emissions were produced using Sparse Matric Operator Kernel Emissions (SMOKE) [
12]. These data were used as the input data of CMAQ.
2.3.2. Meteorological and Emission Input Data
The Global Forecast System (GFS) data of the National Centers for Environmental Prediction (NCEP) were used as the meteorological input data of the WRF model to simulate the weather in Northeast Asia using the model. In addition, MIX inventory [
13] was used for emissions in Northeast Asia, excluding South Korea, as emission inventory to consider anthropogenic emissions in the SMOKE model, and the Globemission data were used for NO
x and HCHO. As for the emissions in South Korea, the 2012 data of the Clean Air Policy Support System (CAPSS) developed by NIER were used.
2.3.3. Model Setup
As for the major physics schemes used for WRF, the WRF single-moment 6-class scheme [
14] was applied for microphysics, the Rapid Radiative Transfer Model scheme [
15] for the longwave radiation process, Goddard shortwave [
16,
17] for shortwave radiation, the Yonsei University scheme [
18] for the planetary boundary layer, and the Kain-Fritch scheme [
19] for cumulus parameterization(
Table 2a).
As for the major physics and chemistry schemes used for CMAQ, Yamartino advection [
20] was used for horizontal and vertical advection, Multiscale [
21] for horizontal diffusion, ACM2 [
22,
23] for vertical diffusion, SAPRC99 (Statewide Air Pollution Research Center, Version 99) [
24] for gas-phase chemistry, and 5th generation CMAQ Aerosol Module (AERO5) [
25] for the aerosol module(
Table 2b).
2.4. Sensitivity Analysis (Brute-Force Method)
Source-receptor sensitivity analysis was conducted using air quality models to estimate domestic (whole South Korea) and foreign (all areas except South Korea in D01) contributions to high PM2.5 concentrations. The sensitivity analysis method used in this study was BFM [
26] proposed by the European Monitoring and Evaluation Programme (EMEP), and the domestic and foreign contribution estimation method proposed by Nam et al. [
27] was applied as follows. The change rate of emissions was applied in the same manner as in a previous study by Kim et al. [
5], and contributions were estimated using the sensitivity results obtained when the anthropogenic emissions of South Korea were reduced by 50%.
In the above equation, CDomestic is the PM2.5 concentration generated by domestic emissions, CBase and CΔ∈ are the PM2.5 concentrations simulated when basic simulation and changed emissions were applied, Δ∈ is the change rate of emissions (%), and RDomestic and RForeign are domestic and foreign contributions.
3. Model Verification Results
To examine the reliability of the PM2.5 concentration simulated by CMAQ, statistical verification was performed using R (correlation), the root-mean-square error (RMSE), the mean bias error (MBE), the normalized mean bias (NMB), and the index of agreement (IOA). The target area for statistical verification was SMA, and evaluation was performed using measurement and simulation data for 160 points in the SMA. The results are shown in
Table 3. The PM2.5 concentration simulated through the model showed a correlation of 0.82 with the measured value and the IOA value of 0.86, indicating that the actual fluctuation tendency of PM2.5 was accurately simulated. The PM2.5 concentration simulated for the target period of this study, however, was 70.7 μg/m
3, which was approximately 16.5 μg/m
3 lower than the measured PM2.5 concentration of 87.3 μg/m
3.
4. Results
4.1. PM2.5 Concentration in SMA
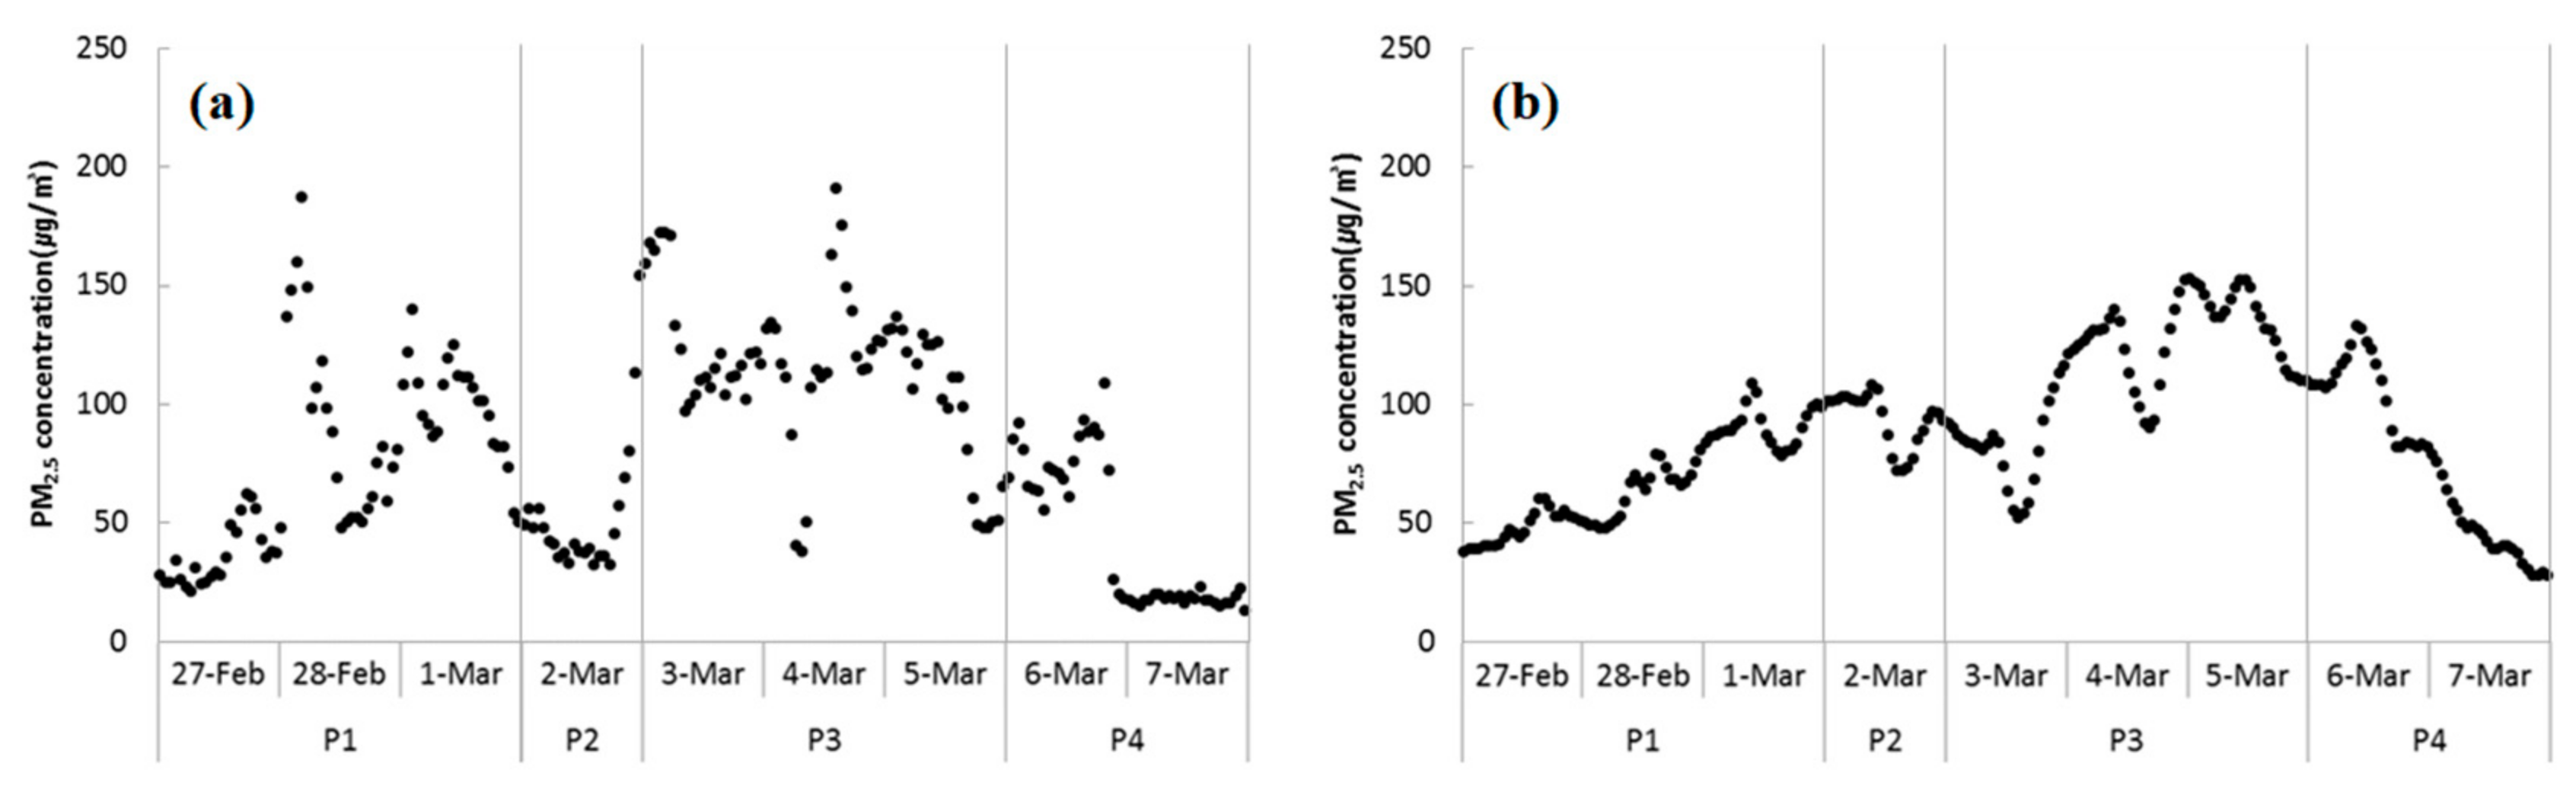
Figure 2 shows the time series data of the hourly PM2.5 concentrations collected from the air pollution intensive monitoring station in Baengnyeong-do and the urban air monitoring network of SMA (Seoul, Incheon, and Gyeonggi-do) from 27 February to 7 March in 2019 when high PM2.5 concentrations occurred in SMA. During the target period of this study, high PM2.5 levels were also observed in Baengnyeong-do, which is a background region with low emissions, as well as in SMA with high emissions because high PM2.5 concentrations of 78.4 and 87.3 μg/m
3 were measured in Baengnyeong-do and SMA. During this case, the difference in the peaks of PM2.5 concentrations observed in Baengnyeong-do and SMA was about 6 to 12 h. In particular, PM2.5 concentration in Baengnyeong-do was found to increase before the Seoul metropolitan area. The target period of this study was divided into P1 (27 February to 1 March), P2 (2 March), P3 (3 March to 5 March), and P4 (6 March to 7 March), according to the PM2.5 concentration variation trend in SMA. The PM2.5 concentrations in SMA measured during each period were found to be 67.1, 93.4, 113.4, and 75.3 μg/m
3. The target period corresponded to eight days (approximately 38%) among a total of 21 days when the “emergency reduction measures against particulate matter”, which had been implemented since 15 February 2017, was issued until August 2019. It was an exceptional case when the emergency reduction measures were continuously issued during the longest period. In addition, very high PM2.5 levels were observed during the target period compared to the annual average PM2.5 concentration measurements in Baengnyeong-do and Seoul (22–24 and 23–26 μg/m
3, respectively) between 2015 and 2017 presented by NIER [
4].
4.2. Analysis of PM2.5 Behavioral Characteristics in Northeast Asia
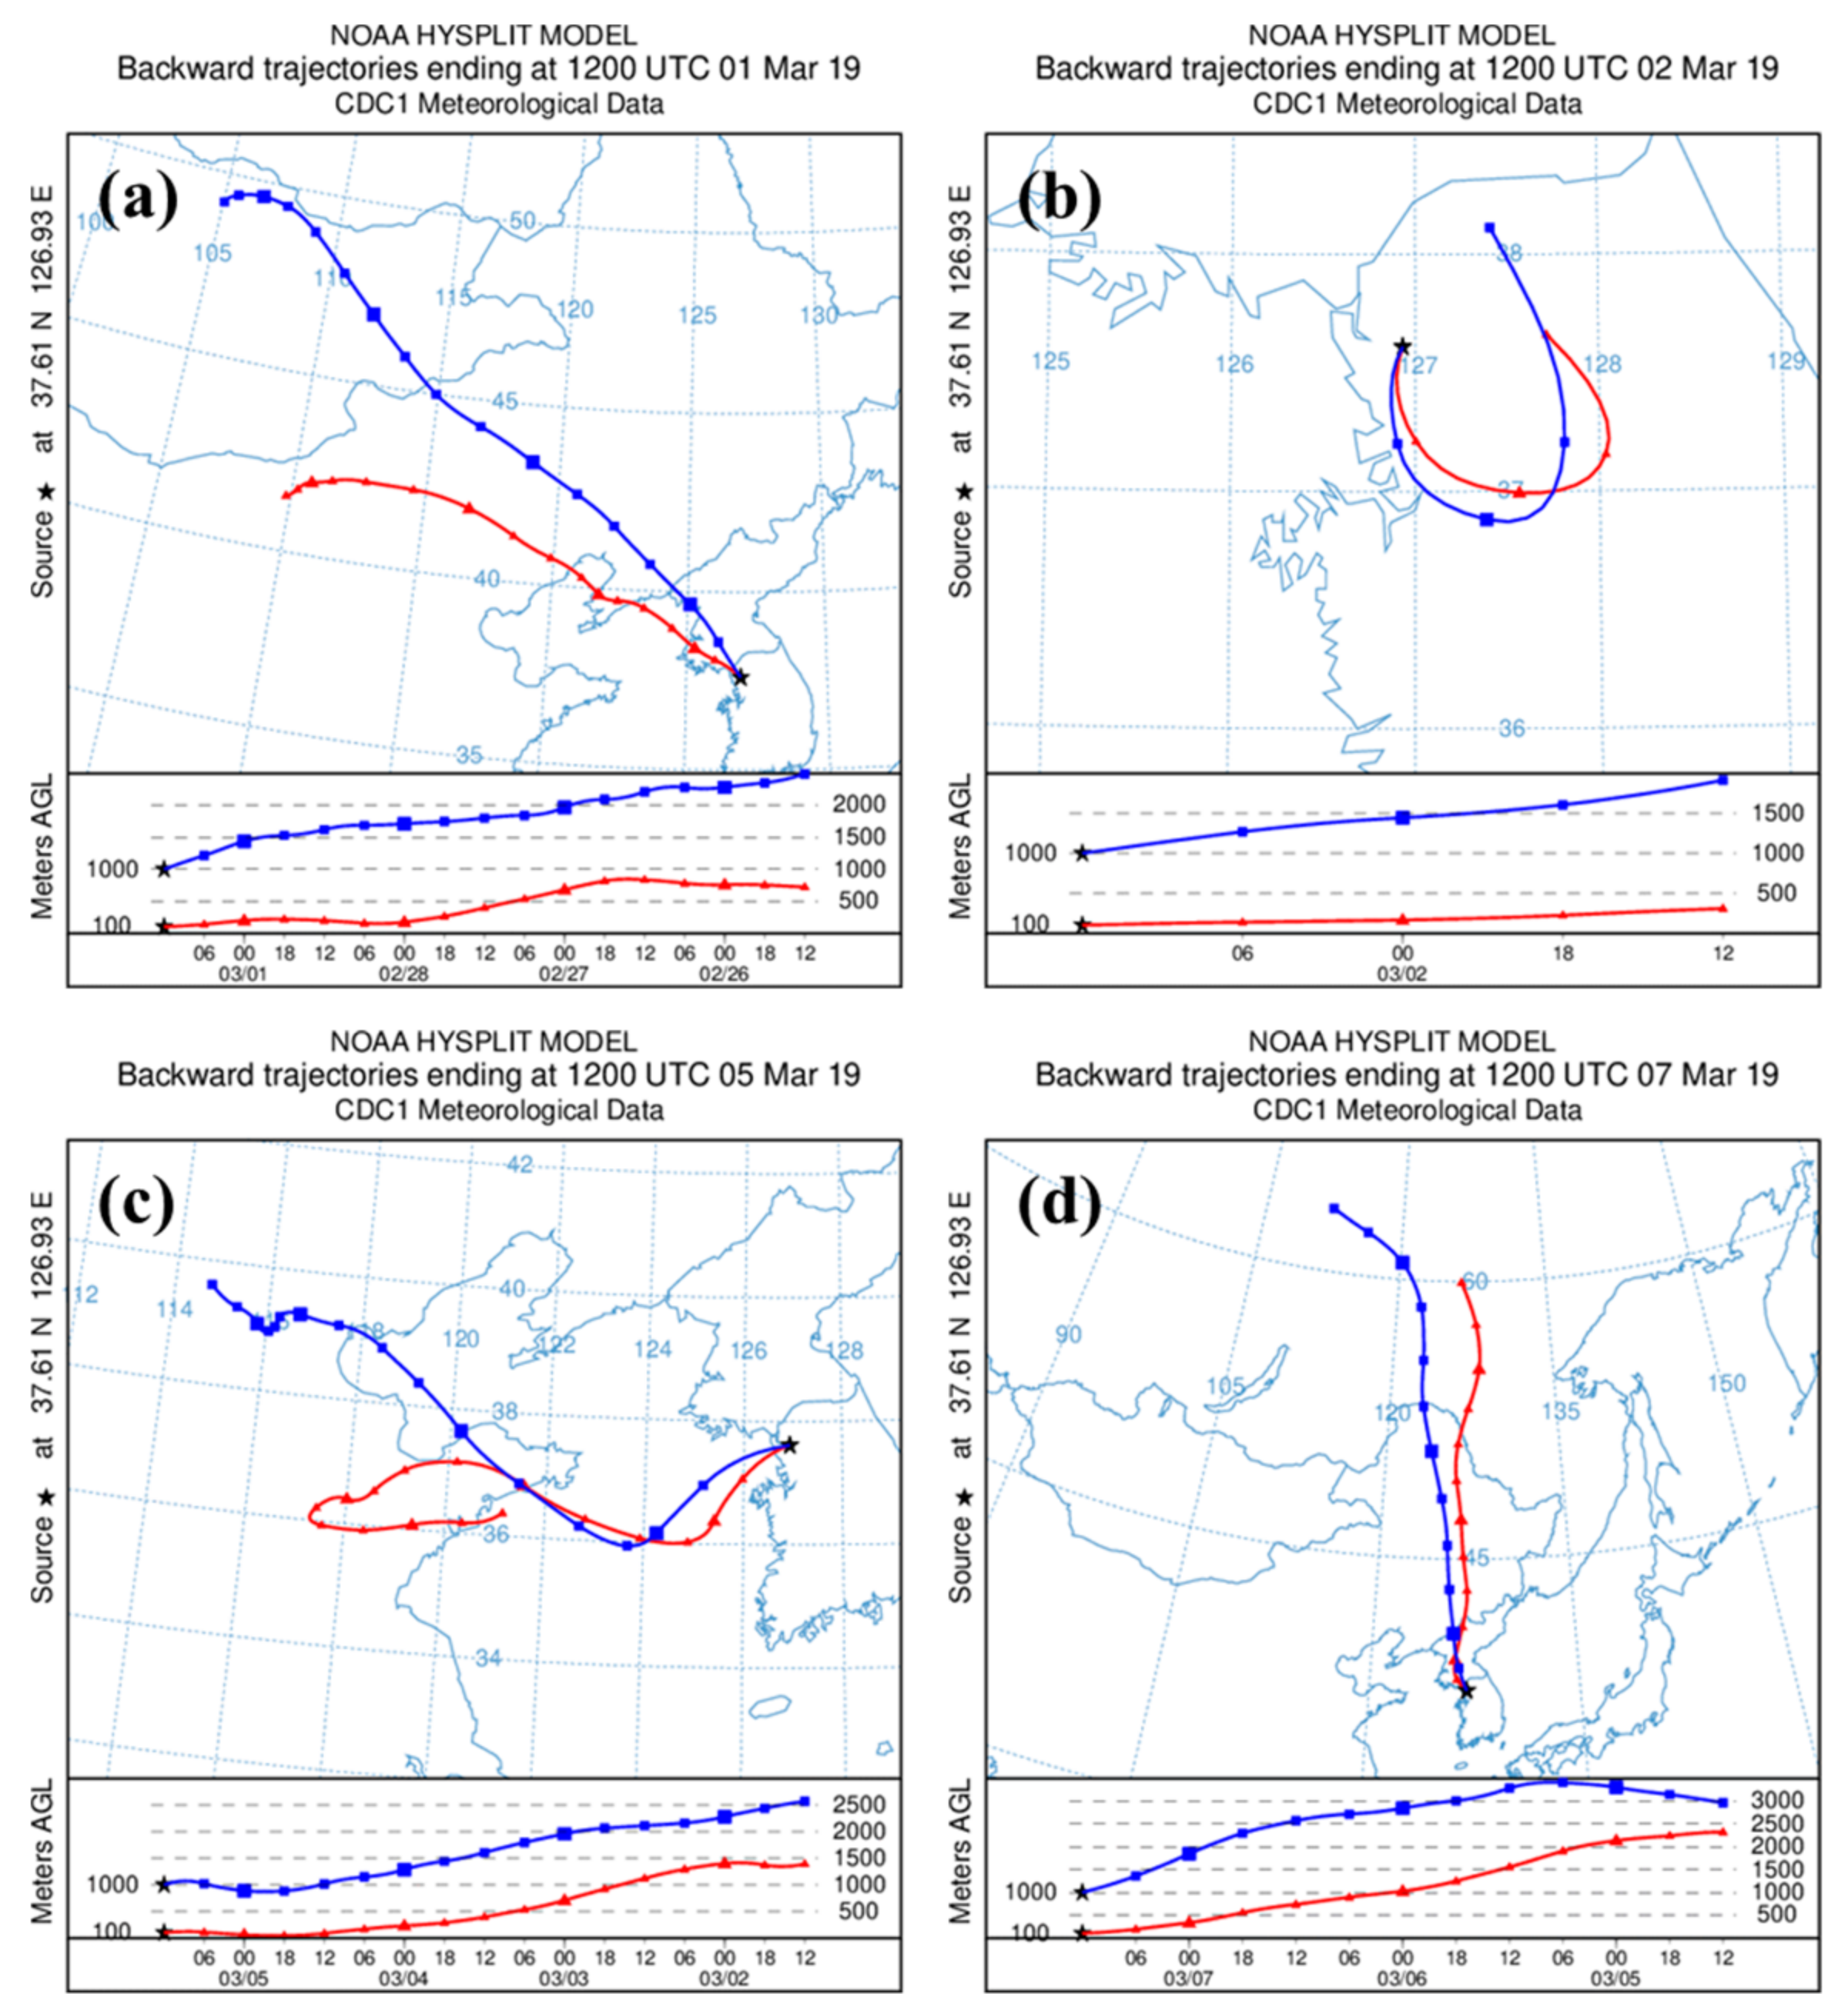
For the periods of P1, P2, P3, and P4, divided according to the PM2.5 concentration variation trend in SMA, the backward-trajectory analysis of air mass at 100 m (lower layer) and 1000 m (upper layer) altitudes in Seoul was conducted using HYSPLIT. In the P1, P2, and P4 periods, the trend of increasing and decreasing trend of PM2.5 concentration was clearly observed, and HYSPLIT was performed from the day before the target period. On the other hand, for P2, which did not show clear changes in PM2.5, inverse trajectory analysis was performed only for the target period to analyze the airflow change on the day. The results of the backward-trajectory analysis using the HYSPLIT model are limited to provide information on the exact origin of the air mass. However, it is possible to infer approximate information on the direction of the air mass and wind speed during each period (P1 to P4).
The results are shown in
Figure 3. During the P1 period, when the PM2.5 concentration soared in SMA, it was found through simulation that the upper-layer air in Seoul moved from northern Mongolia and the lower-layer air from the Inner Mongolia Autonomous Region, and they arrived at Seoul via the northeastern and northern parts of China and the Liaodong Peninsula (
Figure 3a). During the P2 period, when the PM2.5 concentration in SMA did not show any distinct fluctuations, both the upper-layer air and the lower-layer air were stagnant and remained in SMA (
Figure 3b). Afterward, during the P3 period, when the PM2.5 concentration significantly increased again, the air near Beijing, China, moved to Seoul through the upper layer while the air near the Shandong Peninsula flowed into Seoul through the lower layer (
Figure 3c). During the P4 period, when the PM2.5 concentration in SMA was significantly reduced, it was found through simulation that both the upper-layer air and the lower-layer air were strongly blown into South Korea in northerly winds (
Figure 3d).
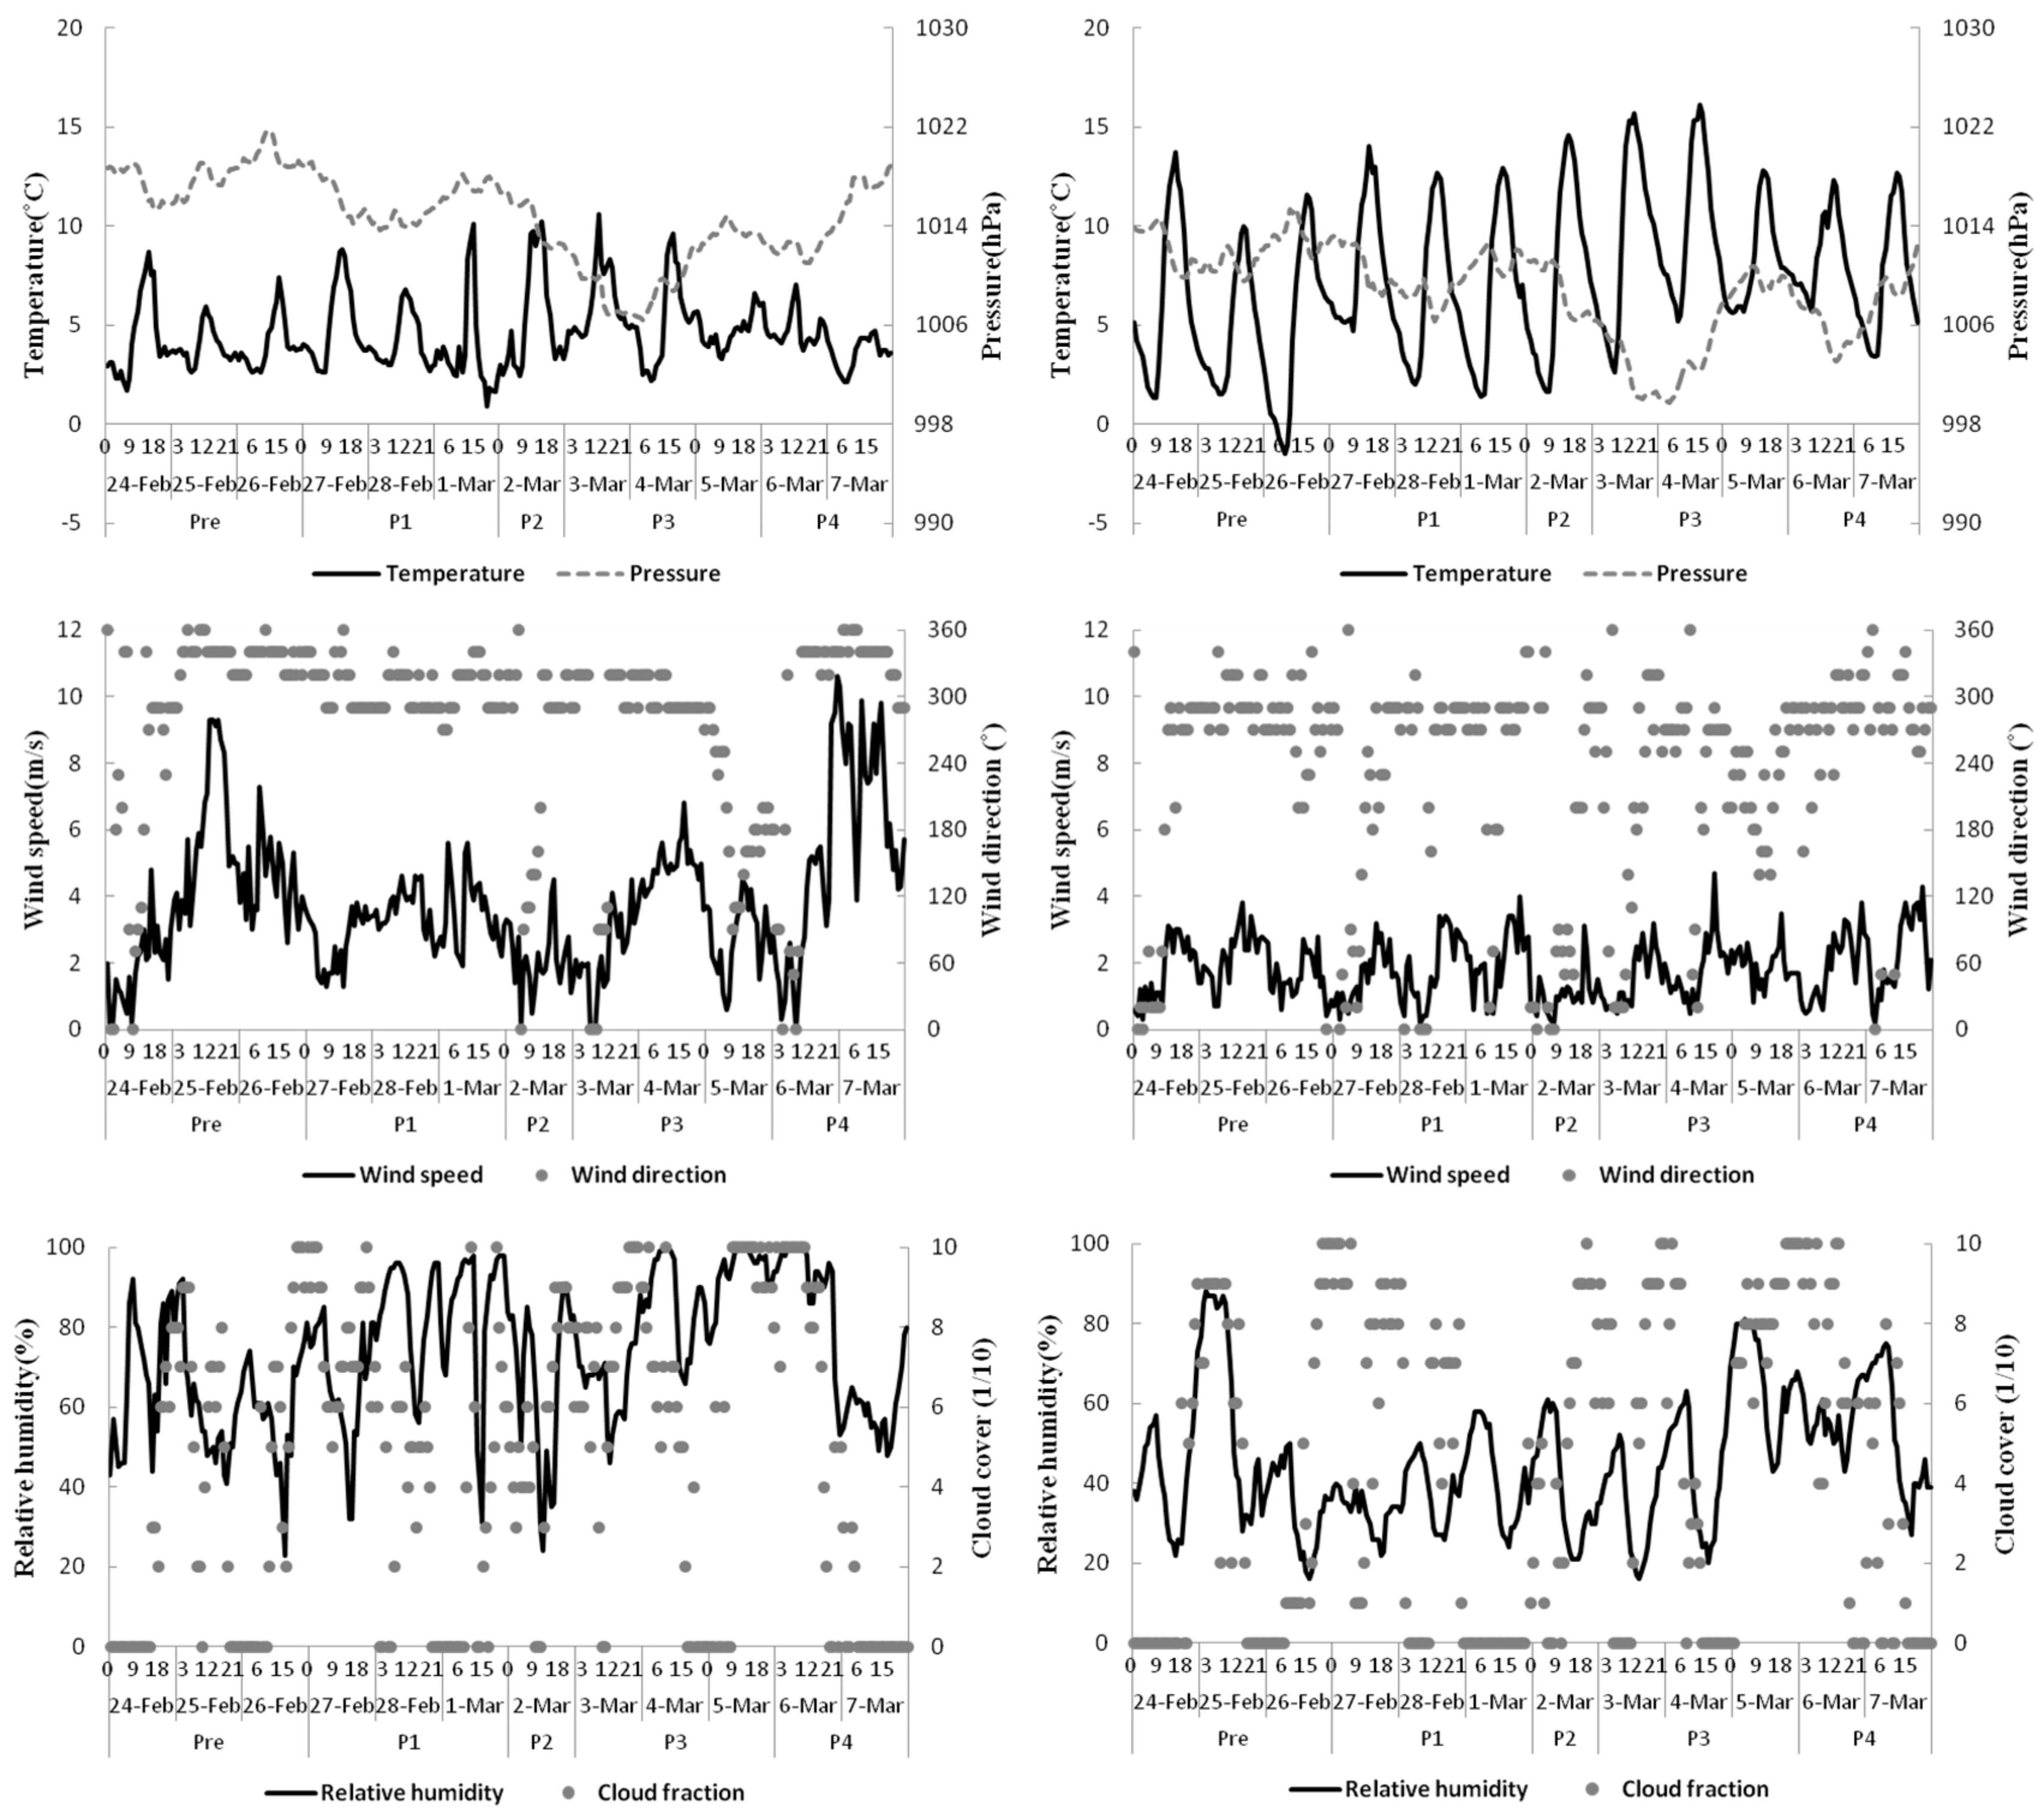
Table 4 shows the temperature(T
sfc), pressure(P
sfc), wind speed(W
spd), relative humidity(RH), and cloud cover(CC) data of Baengnyeong-do and Seoul measured using the ASOS of KMA during the period of high PM2.5 concentrations, and
Figure 4 shows the time series data for these variables and the wind direction. As with the above results of the backward-trajectory analysis conducted using HYSPLIT, northwesterly winds were dominant in Baengyeong-do and westerly winds in Seoul during the P1 and P3 periods when the PM2.5 concentration significantly increased. During the P1 period, the upper-air flowed from northern Mongolia and the Inner Mongolia Autonomous Region, through the Liaoning region in China, and then through North Korea to the SMA region. On the other hand, the ground-level air flowed into the SMA after passing through the Qinhuangdao and Dalian areas in China. During the P3 period, the upper-air flowed from Jing-Jin-Ji Metropolitan Region, China, through the Shandong Peninsula to the Yellow Sea. In addition, the ground-level air stayed near the Shandong Peninsula and was introduced into the SMA region through the Yellow Sea. It is estimated that wind veering occurred during the P2 period when the atmosphere was stagnant because the wind direction was evenly distributed in all directions. It was found that northerly winds occurred, and the temperature slowly decreased at the same time in Baengnyeong-do during the P4 period when the inflow of strong northerly winds was estimated through simulation. In Seoul, the temperature also showed a tendency to decrease, but westerly and northerly winds were observed at the same time. This appears to be because of the inland location of Seoul and the influence of the terrain around the monitoring stations. In addition, during the P2 period, when the atmosphere was stagnant, the wind speed in Baengnyeong-do decreased by 1.1 m/s, and that in Seoul decreased by 0.7 m/s compared to the P1 period. During the P4 period when the PM2.5 concentration in SMA significantly decreased, the temperature decreased by 1.1 and 1.2 °C in Baengnyeong-do and Seoul, respectively, due to the inflow of clean and strong northerly winds, and the wind speed increased by 2.2 and 0.3 m/s compared to the P3 period. In addition, Baengnyeong-do, an island far from the inland areas, exhibited lower temperatures and higher wind speeds due to lower friction than Seoul, an inland area with a dense population.
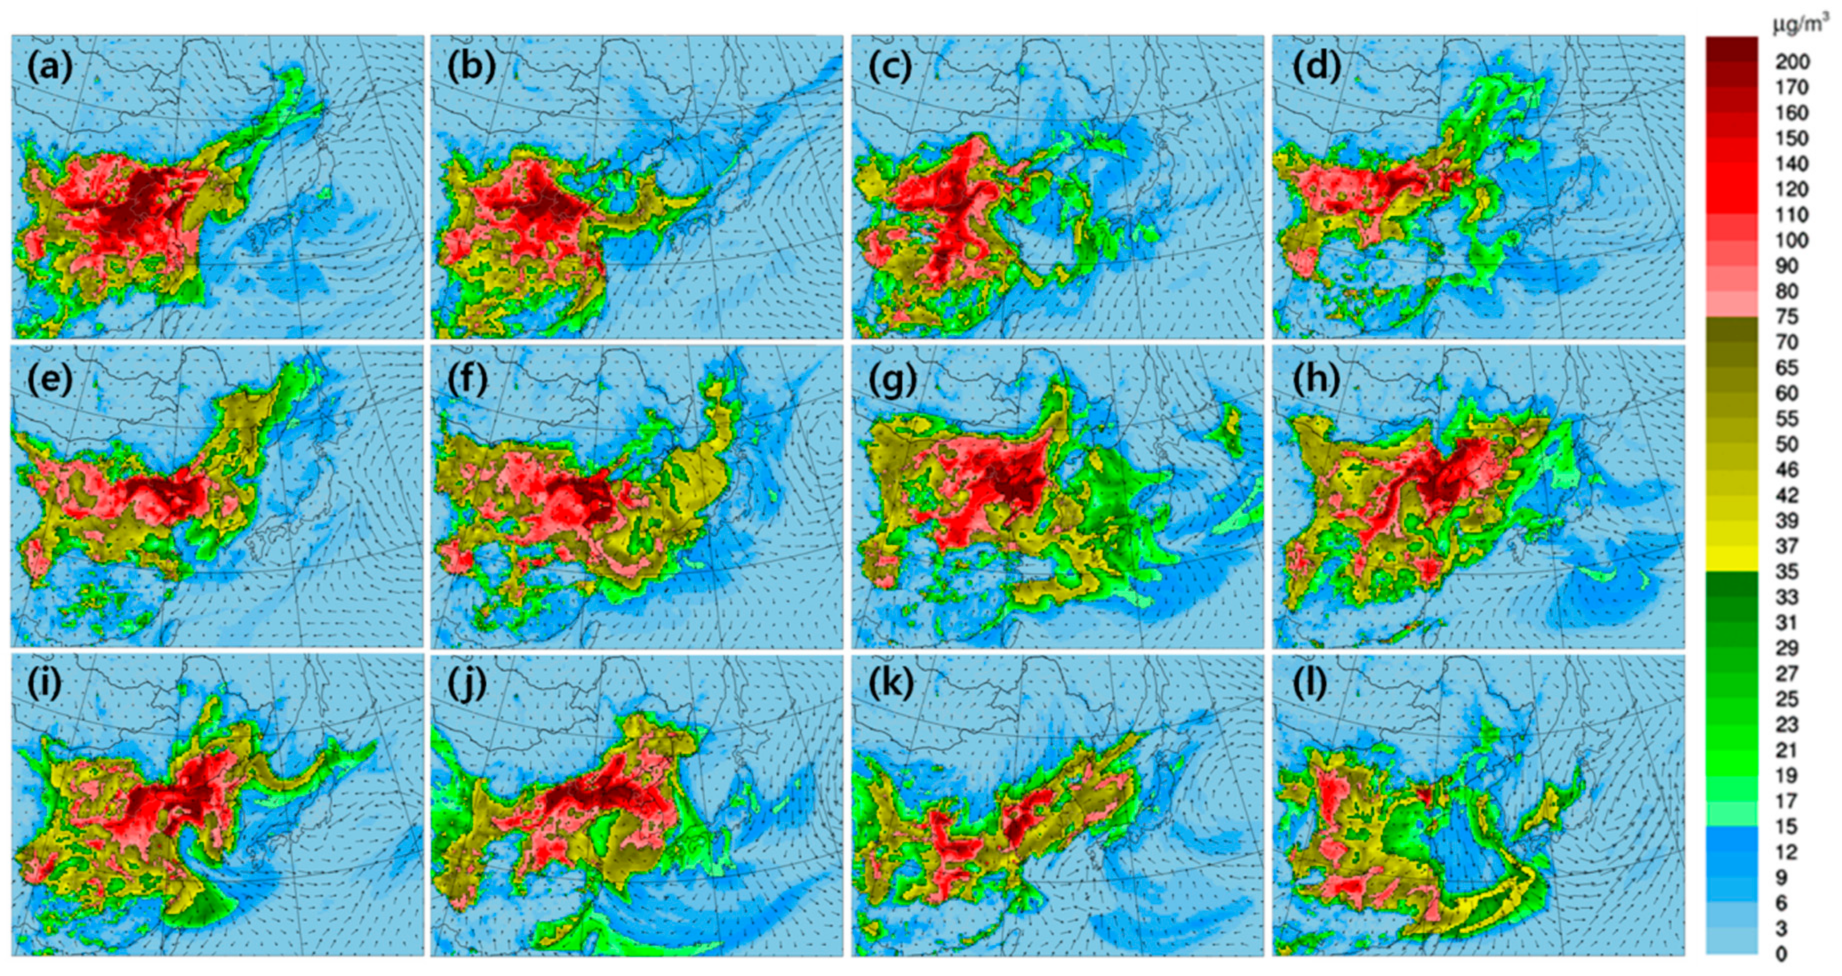
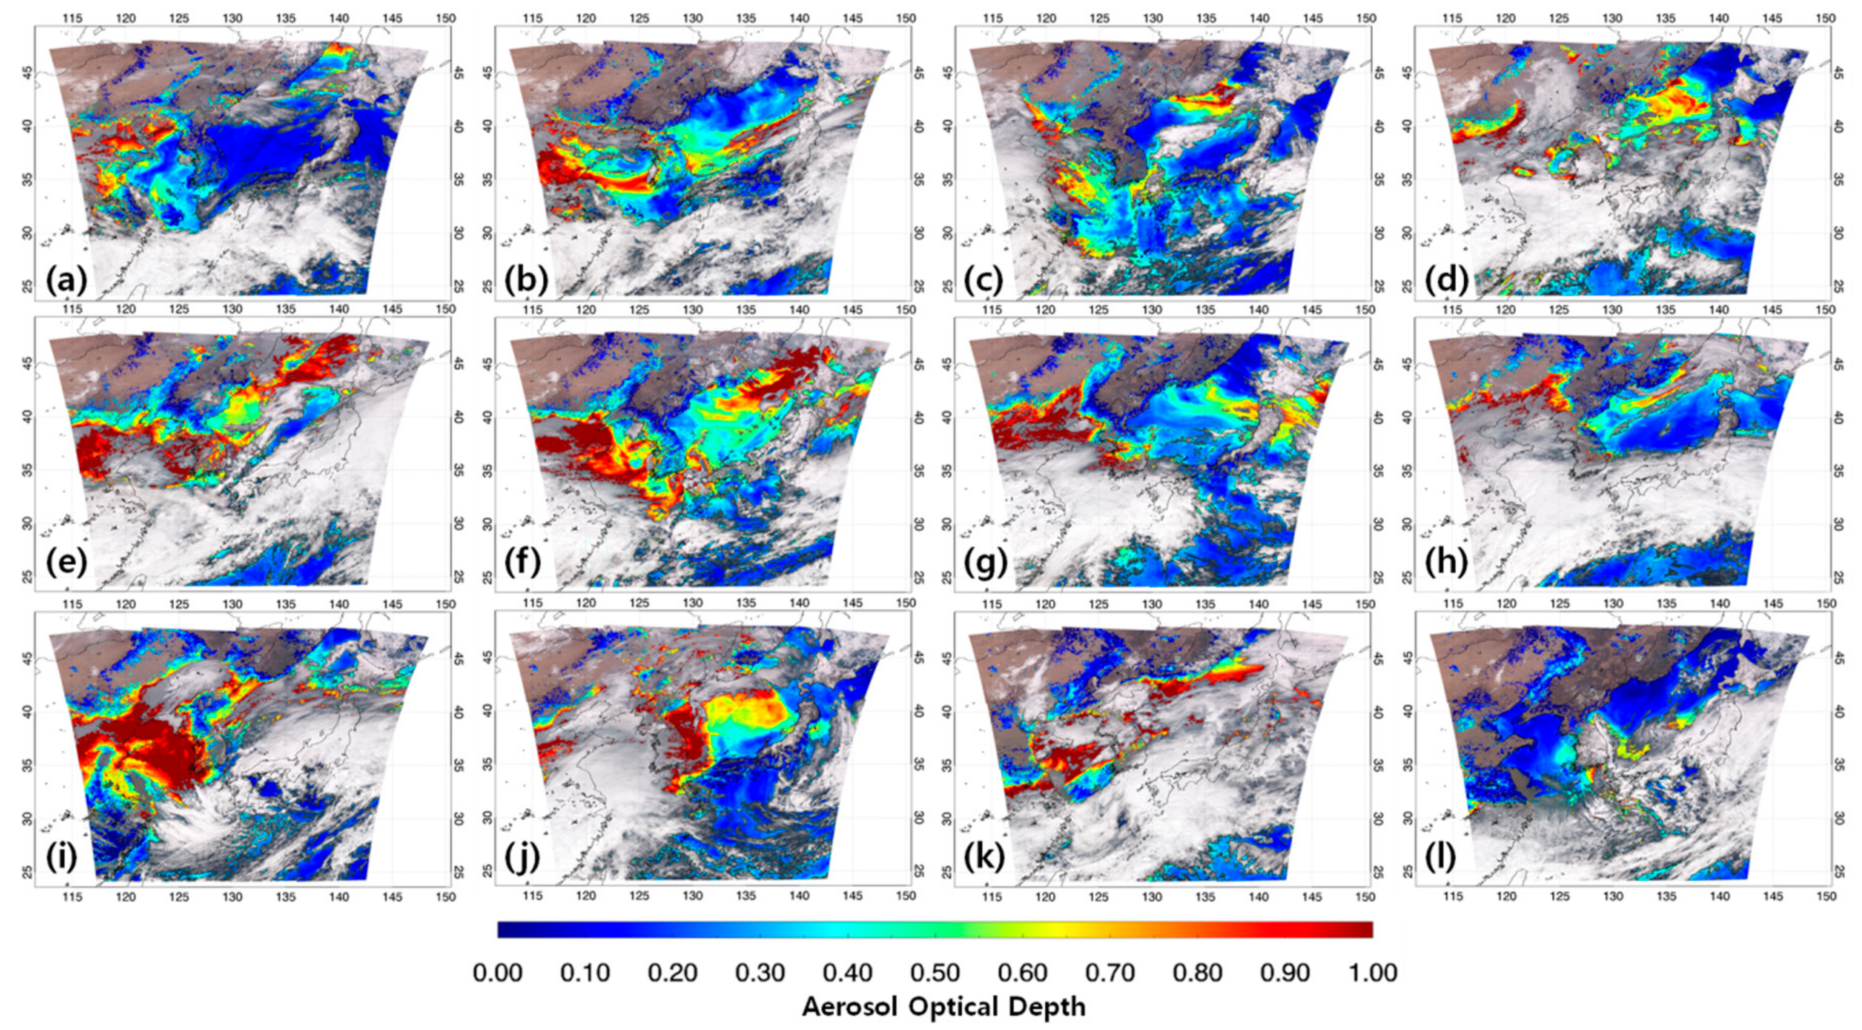
The PM2.5 spatial distribution in Northeast Asia simulated by CMQA and the AOD data of Northeast Asia obtained from the GOCI satellite between 24 February 24 and 7 March in 2019 were shown in
Figure 5 and
Figure A1. Although there were areas that could not be observed from the satellite due to clouds during some periods, the PM2.5 spatial distribution in Northeast Asia simulated by CMAQ was generally similar to the AOD data obtained from the GOCI satellite. The PM2.5 spatial distribution simulated through WRF and CMAQ suggests that most of the high PM2.5 concentrations observed in SMA were affected by the trans-boundary air pollutants transported over long distances in Northeast Asia.
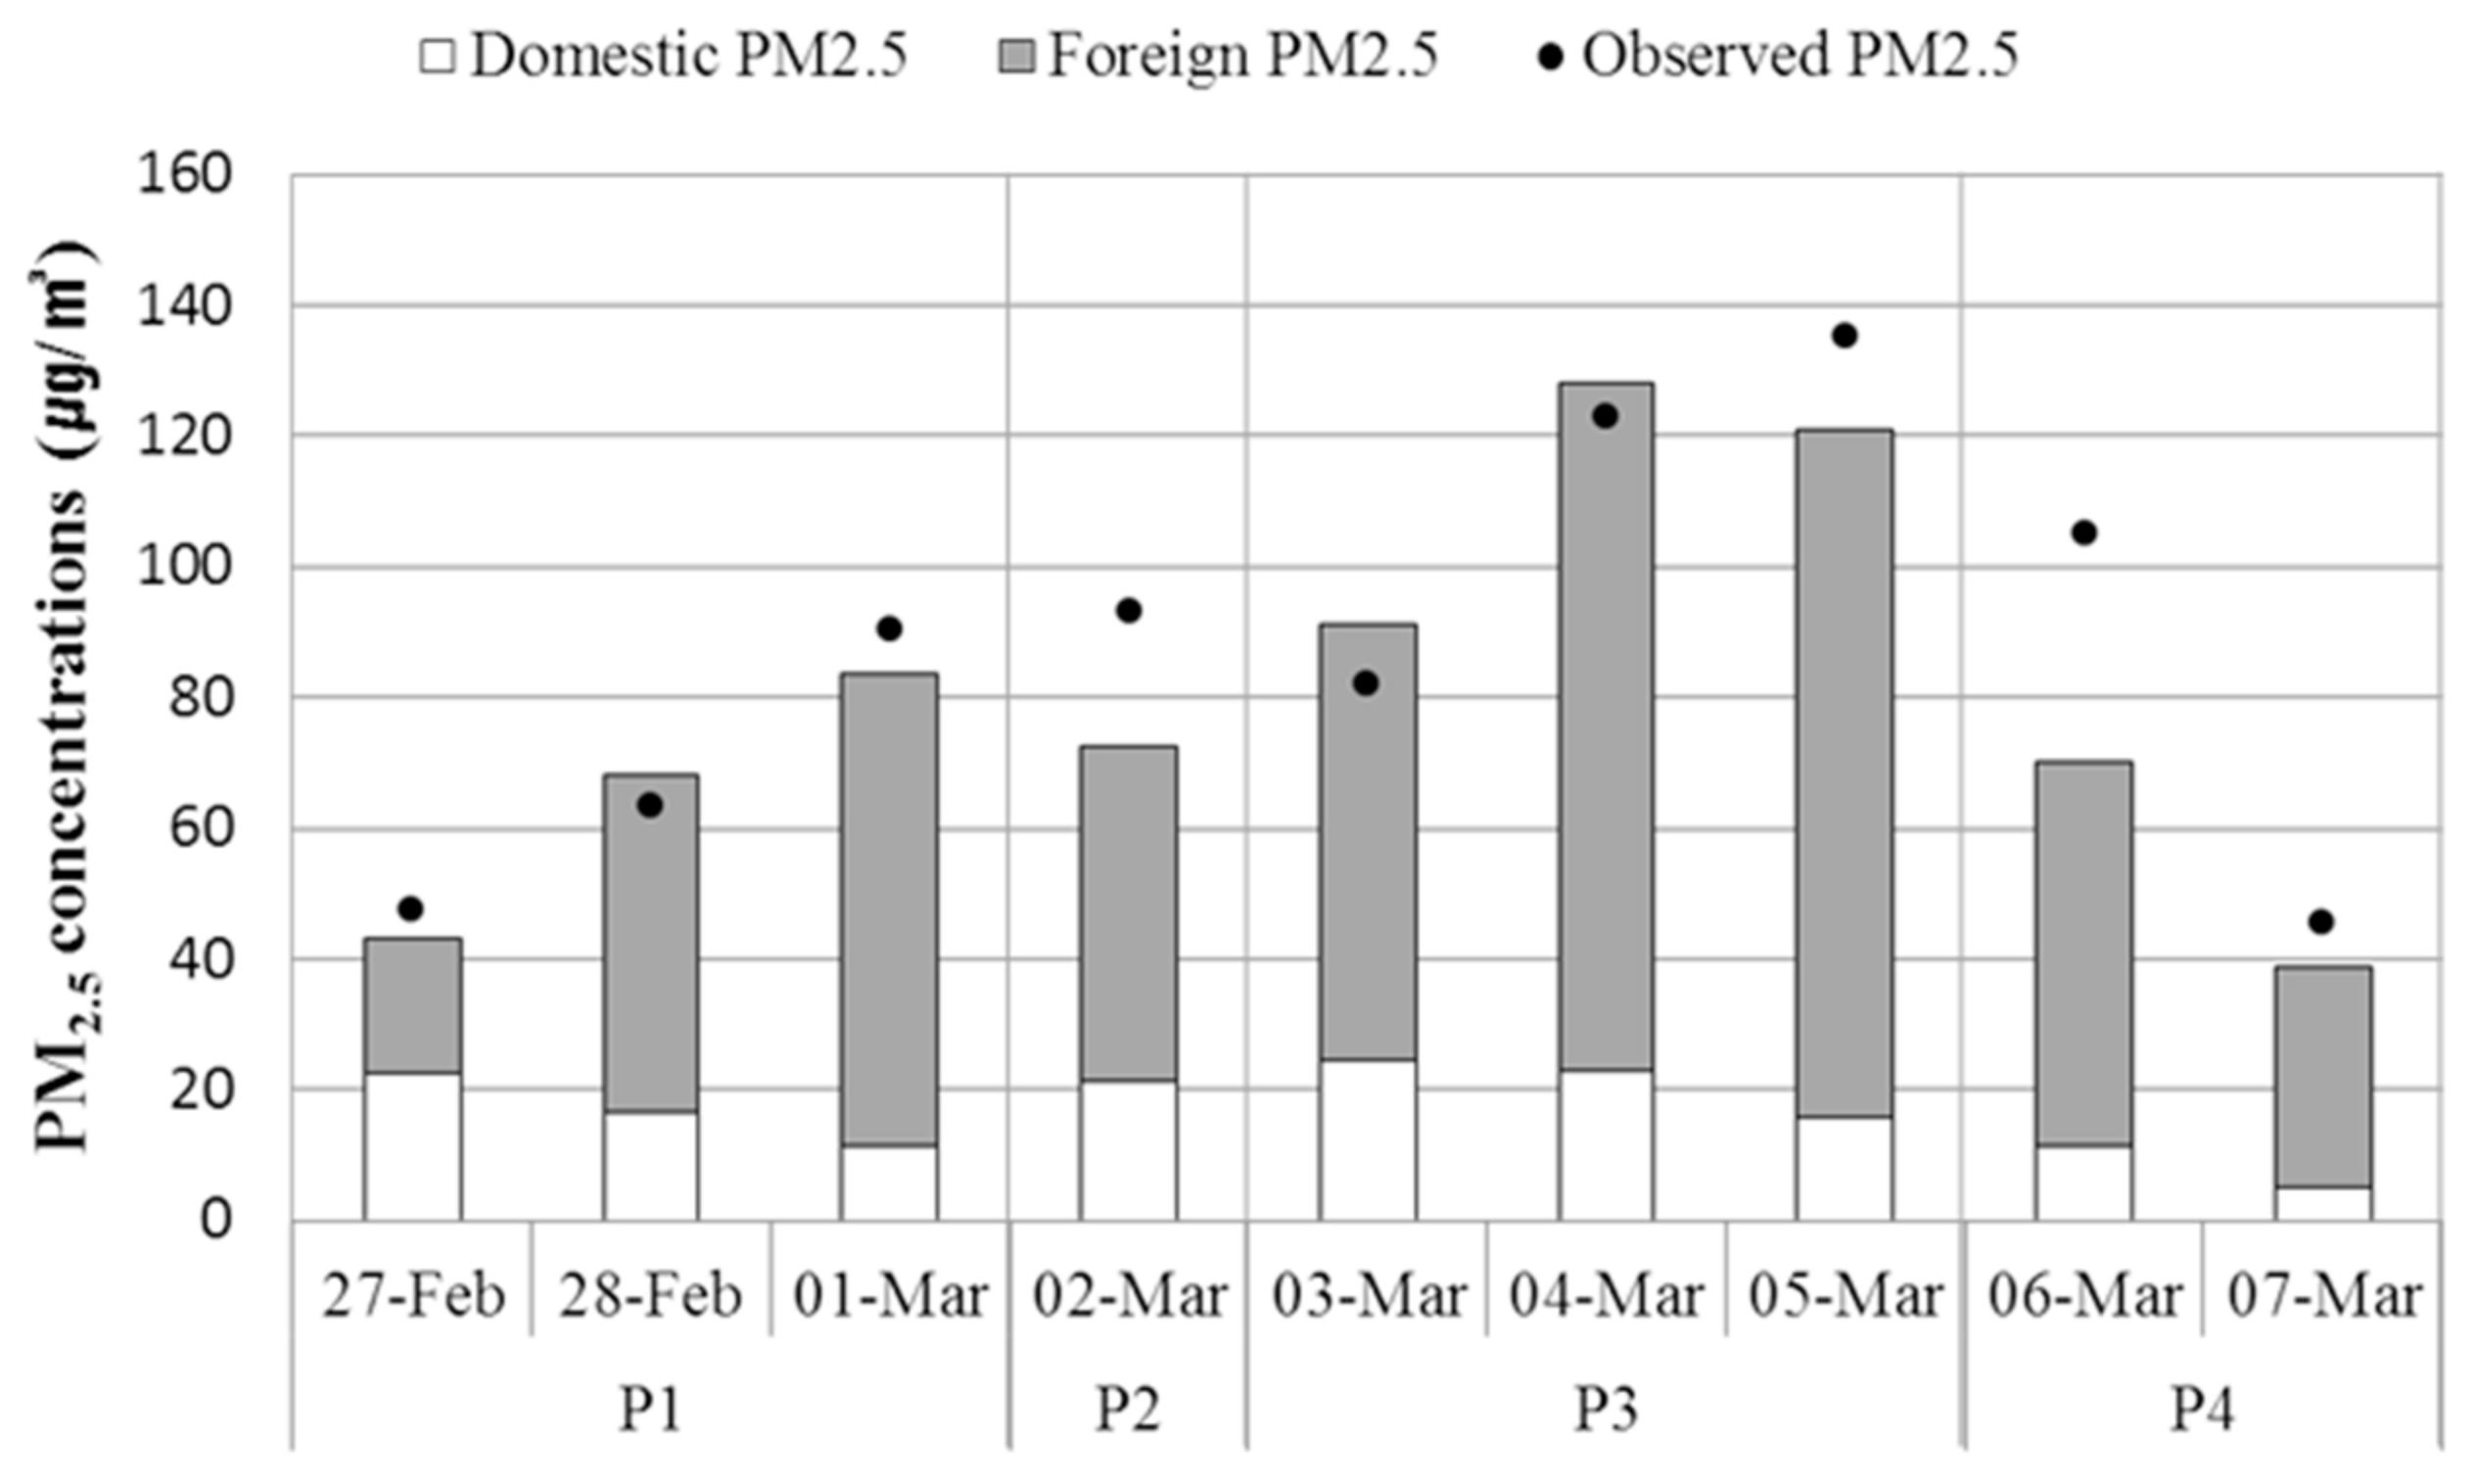
4.3. Contribution Analysis
Figure 6 shows daily averaged domestic contribution concentrations to the PM2.5 concentrations in SMA between 27 February and 7 March estimated by applying BFM to CMAQ. The results of the analysis conducted using BFM showed that the foreign contribution to the SMA region increased from 47.9% to 86.2% during the P1 period when the PM2.5 concentration in SMA increased. Later, during the P2 period, when the atmosphere was stagnant, the foreign contribution decreased to 70.4%, but the additional inflow of foreign air pollutants under the influence of westerly winds increased the foreign contribution to 87.0% on 5 March. On 6 March and 7 March, the domestic and foreign PM2.5 contribution concentrations decreased due to the inflow of clean northerly winds, but the foreign contribution did not show a distinct decrease. This appears to be because of the influence of the residual PM2.5 that was already introduced during the P3 period. The results of analyzing the sensitivity using BFM showed that the domestic and foreign PM2.5 contribution concentrations that affected the PM2.5 concentrations in SMA between 27 February and 7 March in 2019 were 16.8 and 62.8 μg/m
3, respectively, and that the average domestic and foreign contributions were 21.2% and 78.8%. This indicates that the severe PM2.5 concentrations that occurred in South Korea between late February and early March in 2019 were significantly affected by PM2.5 transported over long distances from abroad and its precursors.
5. Conclusions
This study attempted to understand the severe PM2.5 concentrations that occurred in the SMA from 27 February to 7 March in 2019 from various perspectives using weather and PM2.5 measurement data, satellite data, and air quality models. In addition, domestic and foreign contributions to the PM2.5 concentrations were estimated by applying the BFM to the CMAQ model.
During the target period of this study, PM2.5 concentrations as high as 87.3 μg/m3 were measured in SMA. The target period was divided into P1 (27 February to 1 March) and P3 (3 March to 5 March) when the PM2.5 concentration increased, P2 (2 March) when the concentration was maintained, and P4 (6 March to 7 March) when the concentration clearly decreased, according to the PM2.5 concentration in SMA.
The results of the backward-trajectory analysis conducted using the HYSPLIT model showed that the air mass moved to Seoul via the eastern and northern parts of China and the Liaodong Peninsula during the P1 period. Atmospheric stagnation and wind veering occurred during the P2 period, and the air around Beijing and the Shandong Peninsula was introduced to Seoul during the P3 period. During the P4 period, when the PM2.5 concentration decreased, northerly winds were introduced to South Korea.
When the domestic and foreign contribution concentrations and contributions were analyzed by applying BFM to CMAQ, it was found that the foreign contribution increased from 47.9% to 86.2% during the P1 period when the PM2.5 concentration in SMA increased. It decreased to 70.2% during the P2 period when the atmosphere was stagnant but increased to 87.0% during the P3 period when the PM2.5 concentration increased again. This indicates that the severe PM2.5 concentrations that occurred in SMA during the target period of this study were significantly affected by PM2.5 transported over long distances from abroad and its precursors in addition to domestic emissions.
In Northeast Asia, the mutual effects of trans-boundary particulate matter and its precursors transported over long distances between counties may exist depending on weather conditions. Therefore, it is necessary to accurately diagnose the effect of trans-boundary particulate matter and to comprehensively consider changes in domestic emission sources and weather conditions for establishing effective particulate matter reduction measures, as the weather and air quality models, emission input data, and contribution calculation methods used in this study to estimate the domestic and foreign contributions include uncertainties. Accordingly, the results of quantitative contribution evaluation may be different, considering these factors. However, in order to establish an effective air quality improvement policy, it is necessary to continuously evaluate and improve the uncertainty of each factor.
Author Contributions
Data curation, J.P. and H.-J.S.; Formal analysis, S.-J.B.; Investigation, J.-Y.C.; Methodology, K.-P.N.; Project administration, D.L.; Supervision, D.L.; Validation, O.K. and H.-J.P.; Visualization, J.M.; Writing—original draft, K.-P.N.; Writing—review & editing, K.-P.N.
Funding
This work was supported by a grant from the National Institute of Environmental Research (NIER), funded by the Ministry of Environment (MOE) of the Republic of Korea (ex: NIER-RP-2017-149).
Conflicts of Interest
The authors declare no conflicts of interest.
Appendix A
Figure A1.
Aerosol optical depth in Northeast Asia from 24 February to 7 March 2019 (a)–(l), calculated from the GOCI satellite.
Figure A1.
Aerosol optical depth in Northeast Asia from 24 February to 7 March 2019 (a)–(l), calculated from the GOCI satellite.
References
- World Health Organization. Health Effects of Particulate Matter Policy Implications for Countries in Eastern Europe, Caucasus and Central Asia; World Health Organization Regional Office for Europe: Copenhagen, Denmark, 2013; pp. 6–7. [Google Scholar]
- International Agency for Research on Cancer; World Health Organization (WHO). IARC: OutdoorAir Pollution a Leading Environmental Cause of Cancer Deaths; WHO: Geneva, Switzerland, 2013. [Google Scholar]
- Brook, R.D.; Rajagopalan, S.; Pope, C.A., III; Brook, J.R.; Bhatnagar, A.; Diez-Roux, A.V.; Holguin, F.; Hong, Y.; Luepker, R.V.; Peters, M.A.; et al. Particulate matter air pollution and cardiovascular disease: An update to the scientific statement from the American Heart Association. Circulation 2010, 121, 2331–2378. [Google Scholar] [CrossRef] [PubMed]
- National Institute of Environmental Research (NIER). Annual Report of Air Quality in Korea, 2017; NIER-GP2018-040 (Korean literature); National Institute of Environmental Research (NIER): Incheon, Korea, 2018. [Google Scholar]
- Kim, H.C.; Kim, E.; Bae, C.; Cho, J.H.; Kim, B.U.; Kim, S. Regional contributions to particulate matter concentration in the Seoul metropolitan area, South Korea: Seasonal variation and sensitivity to meteorology and emission inventory. Atmos. Chem. Phys. 2017, 17, 10315–10332. [Google Scholar] [CrossRef]
- Draxler, R.R.; Rolph, G.D. HYSPLIT (HYbrid Single-Particle Lagrangian Integrated Trajectory) Model Access via NOAA ARL READY Website; NOAA Air Resources Laboratory: Silver Spring, MD, USA, 2013. [Google Scholar]
- Stein, A.F.; Draxler, R.R.; Rolph, G.D.; Stunder, B.J.B.; Cohen, M.D.; Ngan, F. NOAA’s HYSPLIT atmospheric transport and dispersion modeling system. Bull. Am. Meteorol. Soc. 2015, 96, 2059–2077. [Google Scholar] [CrossRef]
- Rolph, G.; Stein, A.; Stunder, B. Real-time Environmental Applications and Display System: READY. Environ. Model. Softw. 2017, 95, 210–228. [Google Scholar] [CrossRef]
- Skamarock, W.C.; Klemp, J.B. A time-split nonhydrostatic atmospheric model for weather research and forecasting applications. J. Comput. Phys. 2008, 227, 3465–3485. [Google Scholar] [CrossRef]
- Byun, D.W.; Ching, J.K.S. Science Algorithms of the EPA Models-3 Community Multi-Scale Air Quality (CMAQ) Modeling System; EPA Report; EPA/600/R-99/030; EPA: Washington, DC, USA, 1999. [Google Scholar]
- Guenther, A.; Karl, T.; Harley, P.; Wiedinmyer, C.; Palmer, P.I.; Geron, C. Estimates of global terrestrial isoprene emissions using MEGAN (Model of Emissions of Gases and Aerosols from Nature). Atmos. Chem. Phys. Discuss. 2006, 6, 107–173. [Google Scholar] [CrossRef]
- Benjey, W.; Houyoux, M.; Susick, J. Implementation of the SMOKE Emissions Data Processor and SMOKE Tool Input Data Processor in Models-3; EPA: Washington, DC, USA, 2001. [Google Scholar]
- Li, M.; Zhang, Q.; Kurokawa, J.; Woo, J.H.; He, K.B.; Lu, Z.; Ohara, T.; Song, Y.; Streets, D.G.; Carmichael, G.R.; et al. MIX: A mosaic Asian anthropogenic emission inventory under the international collaboration framework of the MICS-Asia and HTAP. Atmos. Chem. Phys. 2017, 17, 935–963. [Google Scholar] [CrossRef]
- Hong, S.Y.; Dudhia, J.; Chen, S.H. A revised approach to ice microphysical processes for the bulk parameterization of clouds and precipitation. Mon. Weather Rev. 2004, 132, 103–120. [Google Scholar] [CrossRef]
- Mlawer, E.J.; Taubman, S.J.; Brown, P.D.; Iacono, M.J.; Clough, S.A. Radiative transfer for inhomogeneous atmospheres: RRTM, a validated correlated-k model for the longwave. J. Geophys. Res. Atmos. 1997, 102, 16663–16682. [Google Scholar] [CrossRef]
- Chou, M.D.; Suarez, M.J. A Solar Radiation Parameterization for Atmospheric Studies; NASA Technical Report 1999; NASA/TM-1999-104606; NASA: Washington, DC, USA, 1999; Volume 15, p. 40. [Google Scholar]
- Chou, M.D.; Suarez, M.J.; Liang, X.Z.; Yan, M.M.H.; Cote, C. A Thermal Infrared Radiation Parameterization for Atmospheric Studies; NASA Technical Report 2001; NASA/TM-2001-104606; NASA: Washington, DC, USA, 2001; Volume 19, p. 68. [Google Scholar]
- Hong, S.; Noh, Y.; Dudhia, J. A New Vertical Diffusion Package with an Explicit Treatment of Entrainment Processes. Mon. Weather Rev. 2006, 134, 2318–2341. [Google Scholar] [CrossRef]
- Kain, J.S. The Kain-Fritsch Convective Parameterization: An Update. J. Appl. Meteorol. 2004, 43, 170–181. [Google Scholar] [CrossRef]
- Yamartino, R.J. Nonnegative, conserved scalar transport using grid-cell-centered, spectrally constrained Blackman cubics for applications on a variable-thickness mesh. Mon. Weather Rev. 1993, 121, 753–763. [Google Scholar] [CrossRef]
- Louis, J.F. A parametric model of vertical eddy fluxes in the atmosphere. Bound. Layer Meteorol. 1979, 17, 187–202. [Google Scholar] [CrossRef]
- Pleim, J.E. A combined local and nonlocal closure model for the atmospheric boundary layer. Part I: Model description and testing. J. Appl. Meteorol. Climatol. 2007, 46, 1383–1395. [Google Scholar] [CrossRef]
- Pleim, J.E. A combined local and nonlocal closure model for the atmospheric boundary layer. Part II: Application and evaluation in a mesoscale meteorological model. J. Appl. Meteorol. Climatol. 2007, 46, 1396–1408. [Google Scholar] [CrossRef]
- Carter, W.P.L. Documentation of the SAPRC-99 Chemical Mechanism for VOC Reactivity Assessment, Report to California Air Resources Board; Contracts 92-329 and 95-308; University of California: Riverside, CA, USA, 1999. [Google Scholar]
- Bartnicki, J. Computing Source-Receptor Matrices with the EMEP Eulerian Acid Deposition Model; Norwegian Meteorological Institute: Oslo, Norway, 1999. [Google Scholar]
- Binkowski, F.S.; Roselle, S.J. Models-3 Community Multiscale Air Quality (CMAQ) model aerosol component 1. Model description. J. Geophys. Res. 2003, 108, 4183. [Google Scholar] [CrossRef]
- Nam, K.P.; Lee, H.S.; Lee, J.J.; Park, H.J.; Choi, J.Y.; Lee, D.G. A study on the method of calculation of domestic and foreign contribution on PM2.5 using Brute-Force Method. J. Korean Soc. Atmos. Environ. 2019, 35, 86–96, (Korean literature). [Google Scholar] [CrossRef]
© 2019 by the authors. Licensee MDPI, Basel, Switzerland. This article is an open access article distributed under the terms and conditions of the Creative Commons Attribution (CC BY) license (http://creativecommons.org/licenses/by/4.0/).


