
U.S. wind power has more than tripled in the past decade to become the largest source of renewable power in the country. The U.S. Department of Energy provides this data, updated annually, to track trends in wind technology, cost, and performance through the end of 2019.
These data are from a combination of publicly available, confidential, and proprietary sources. It provides unbiased, independent, public reporting of the current state of the industry, and insight into multiyear trends.
Wind Technology Data
U.S. wind power additions continued at a strong pace in 2019, with over 9,000 megawatts (MW) of new capacity added, bringing total U.S. capacity to 105.6 gigawatts (GW). Wind power represented the second-largest source of U.S. electric-generating capacity additions in 2019, behind solar.
Improvements in the cost and performance of wind power technologies have also driven wind capacity additions, yielding low-priced wind energy for utility, corporate, and other power purchasers. Continuing the long-term trend, average turbine capacity, rotor diameter, and hub height increased in 2019, significantly boosting wind project performance.
Download a spreadsheet of 2019 Wind Technology Data or view slides that display and summarize the data.

Get details on a few of the lesser known wind energy facts.
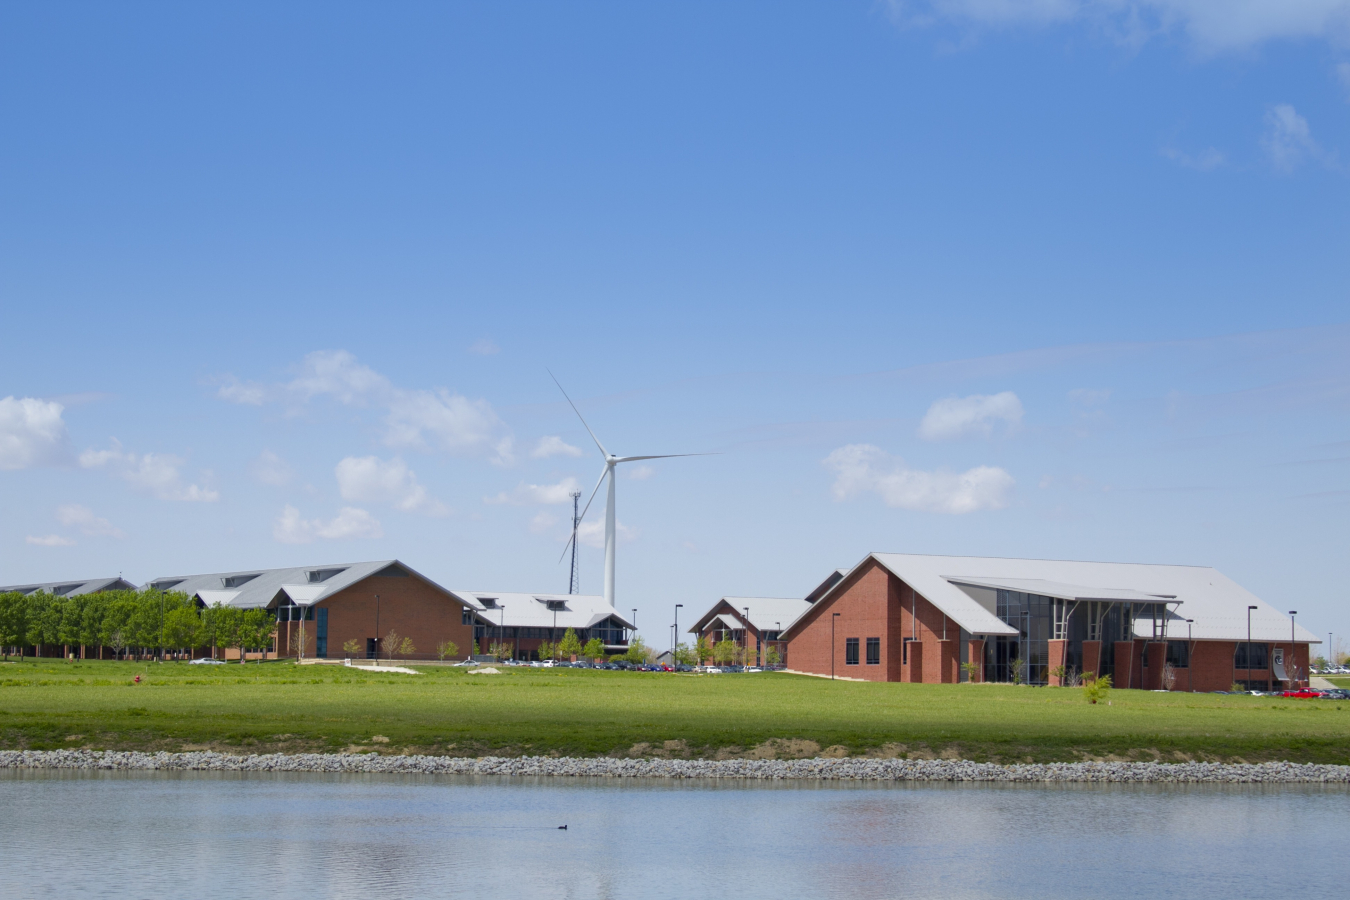
Distributed Wind Data
Cumulative U.S. distributed wind capacity installed from 2003 to 2019 is over 1,100 MW from more than 85,000 wind turbines across all 50 states, Puerto Rico, the U.S. Virgin Islands, and Guam.
In 2019, 17 states added 18 MW of new distributed wind capacity, representing 2,166 units and $67 million in investment. From Pennsylvania to California, distributed wind systems were installed to serve agricultural, commercial, government, industrial, institutional, residential, and utility customers.
Download a spreadsheet of 2019 Distributed Wind Data or view slides that display and summarize the data.
Check out our Distributed Wind Photo Gallery for case studies and more information on distributed wind.
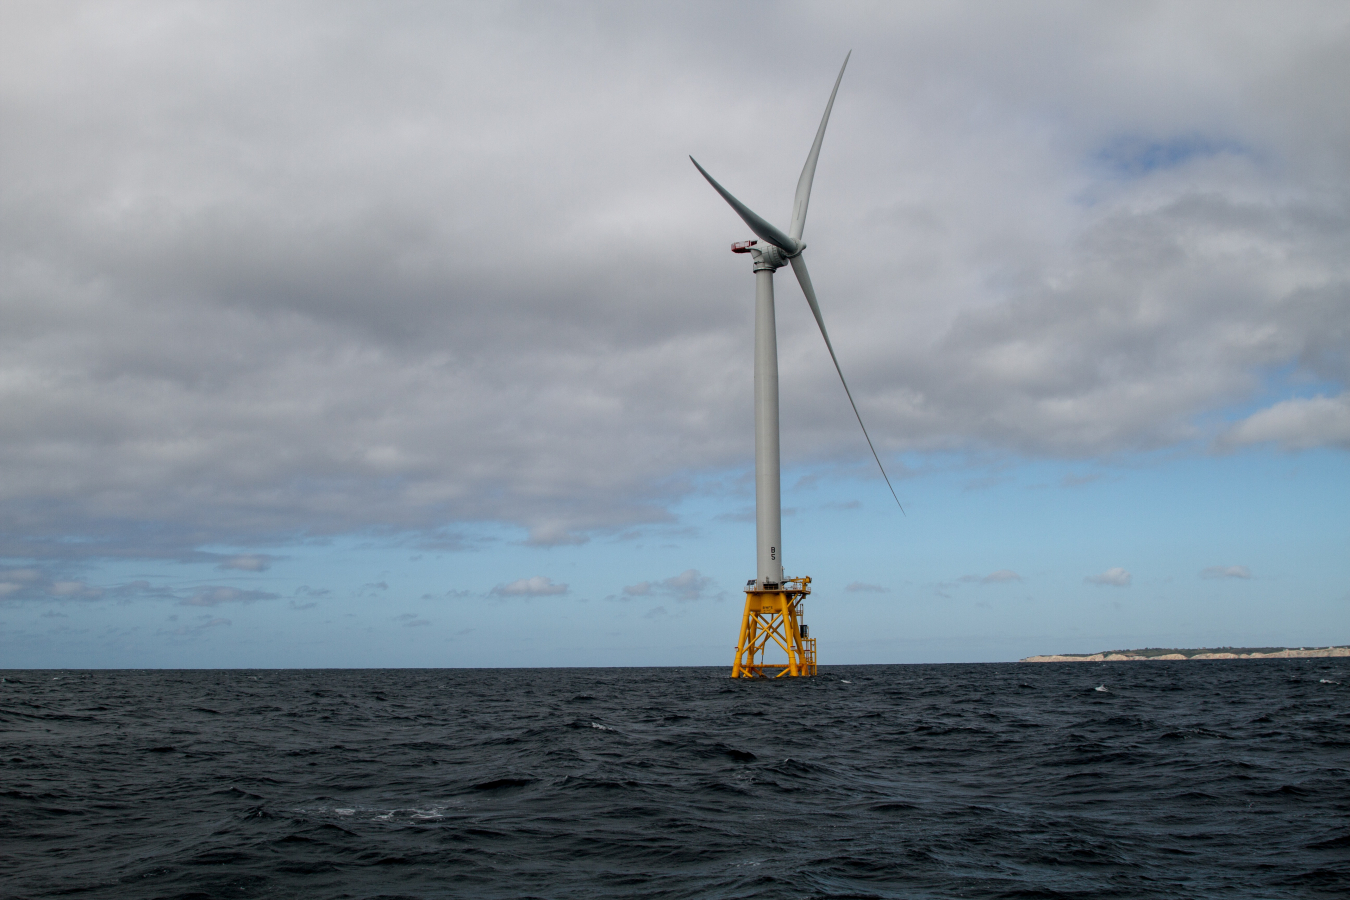
Offshore Wind Data
The U.S. offshore wind pipeline grew from 25,824 MW in 2018 to 28,521 MW by the end of 2019. In March 2020, the amount of offshore wind capacity under federal and state permitting with a signed offtake agreement was 6,439 MW—more than triple the capacity reported the previous year.
Globally, the capacity-weighted average offshore turbine size has grown from 3.5 MW in 2010 to 6 MW in 2019. Similarly, rotor diameters have grown from 100 meters (m) in 2010 to 150 m in 2019. Offshore wind turbines with capacities of 10 to 14 MW are planned for deployment in the 2021–2024 timeframe.
Download a spreadsheet of 2019 Offshore Wind Data or view slides that display and summarize the data.
Learn more about efforts to develop America's vast offshore wind resources.
Learn More About Wind Energy
Learn more about the wind industry, from how a wind turbine works, to new and exciting research in the field of wind energy.